
Introduction — Graphix Lab Designs for Restaurant & Hospitality
Create weekly, monthly and quarterly custom reports for multi-location hospitality clients. This sample dashboard showcases portfolio work, industry-focused KPIs, charts and pricing templates you can present to global clients.
Quick KPIs
Sample Portfolio Work
Industry Specific — Operations
Location performance, labor cost %, average check, cover counts, table turnover, reservation conversion.
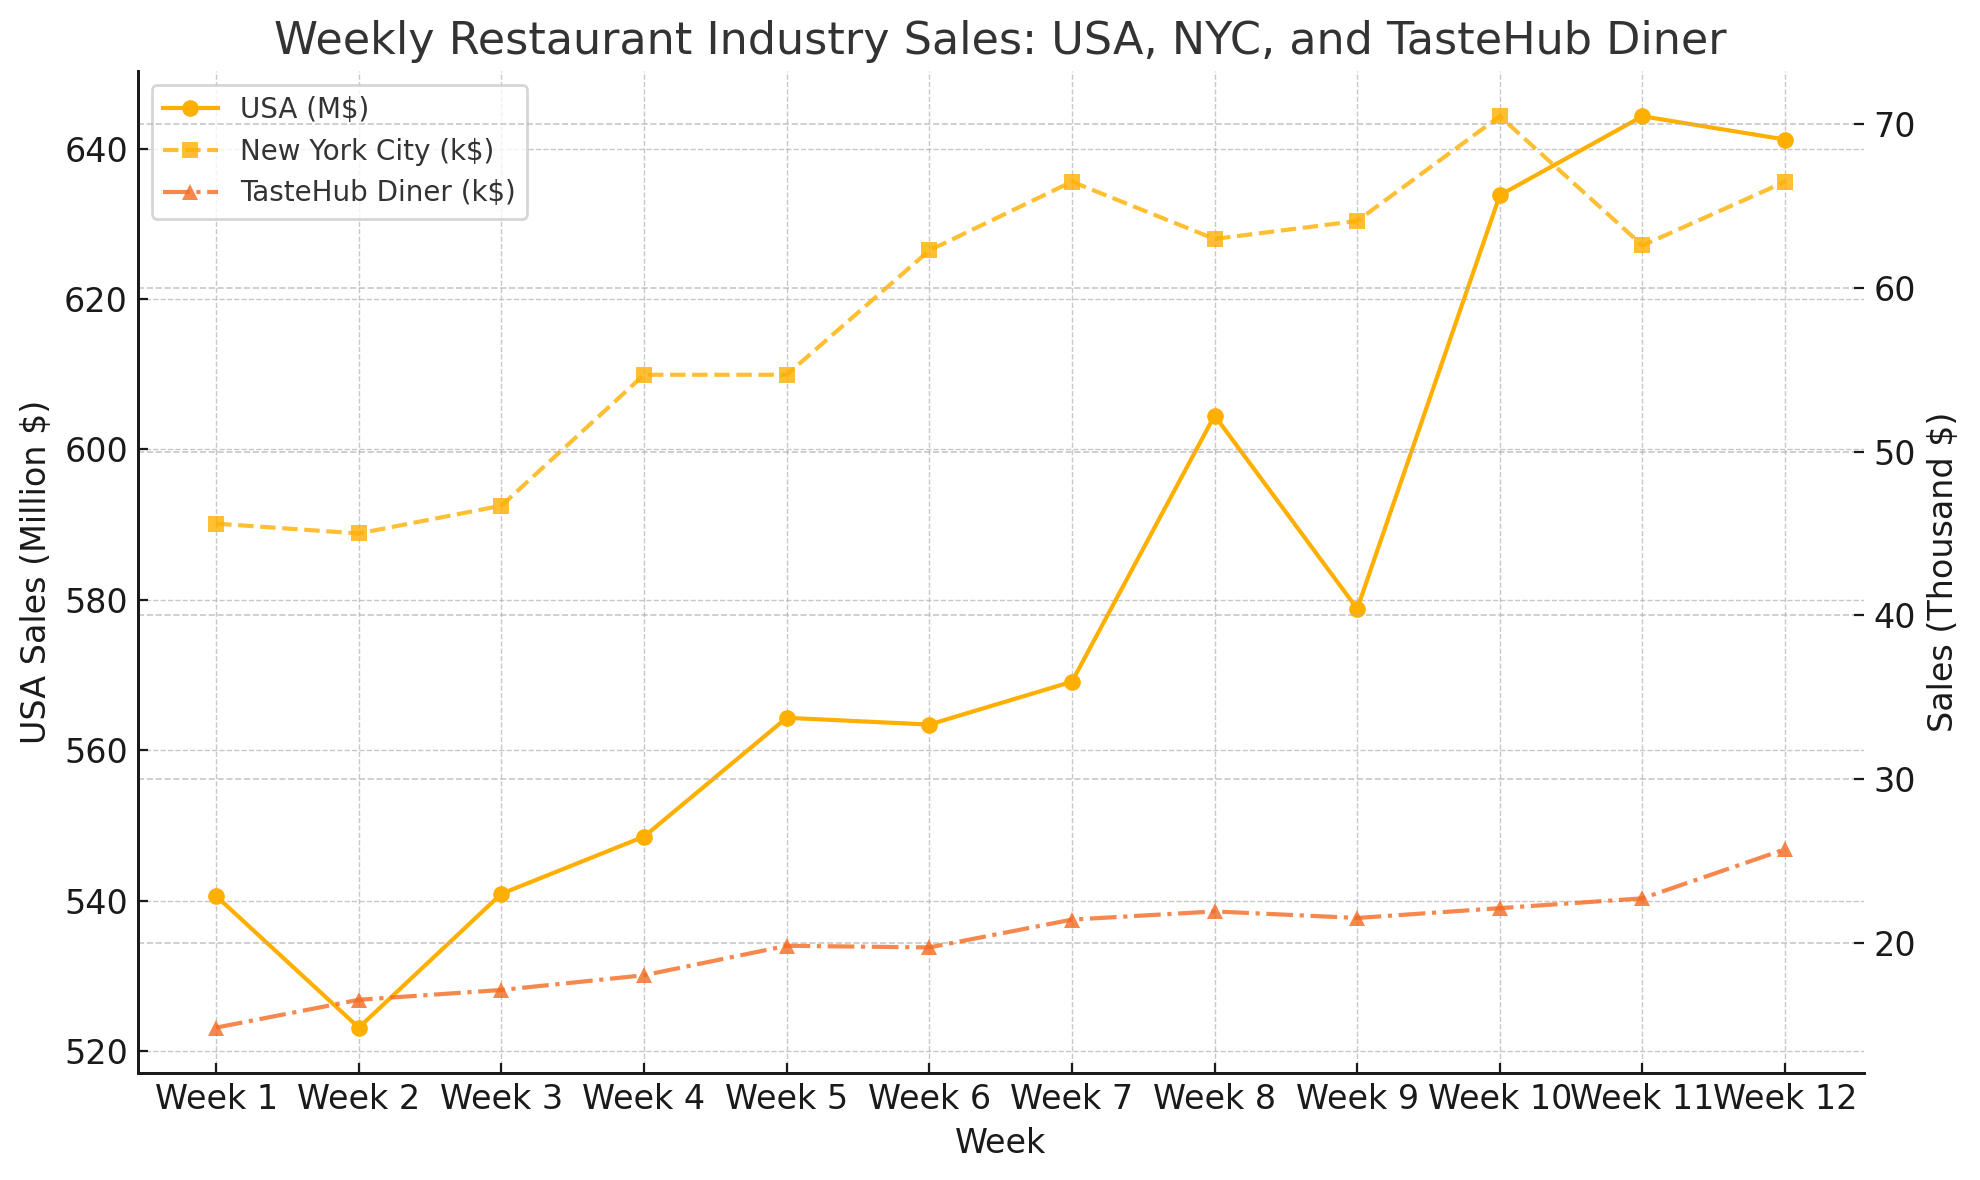
- Weekly: covers, revenue, labor hours, wastage
- Monthly: profit margins, menu mix, COGS by item
- Quarterly: trend analysis, location comparisons, capital expense impacts
Industry Specific — Marketing
Campaign ROI, customer acquisition cost (CAC), retention cohorts, loyalty program uptake.
Industry Specific — Experience
NPS, online review sentiment analysis, peak-hour staffing recommendations.
Pricing (Sample Packages)
Standardized reporting packages — deliverables tailored per package and location.
- Weekly revenue & KPI snapshot
- Top 5 menu items
- Email summary
- Monthly trend & menu mix
- Marketing attribution
- 2 x strategy calls
- Full financial model
- Site-by-site benchmarking
- Custom dashboards & training
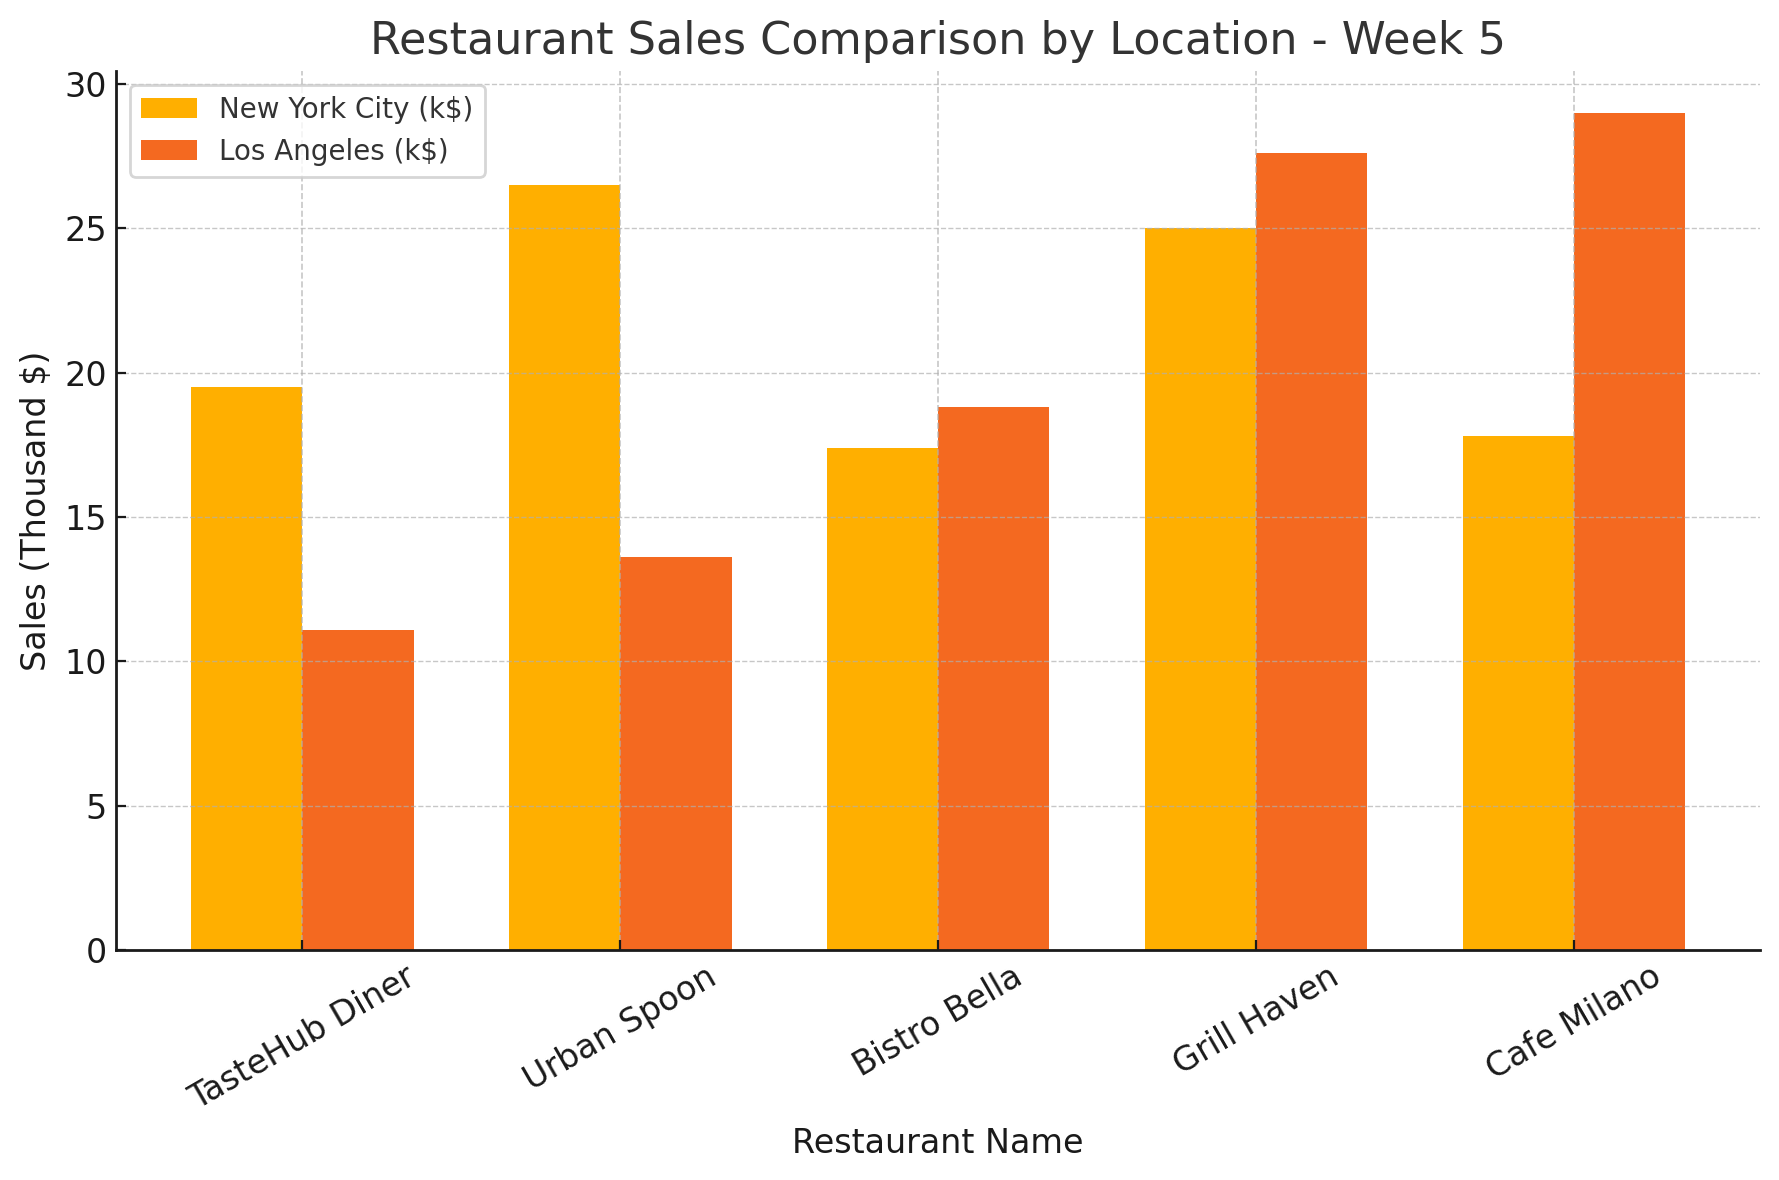
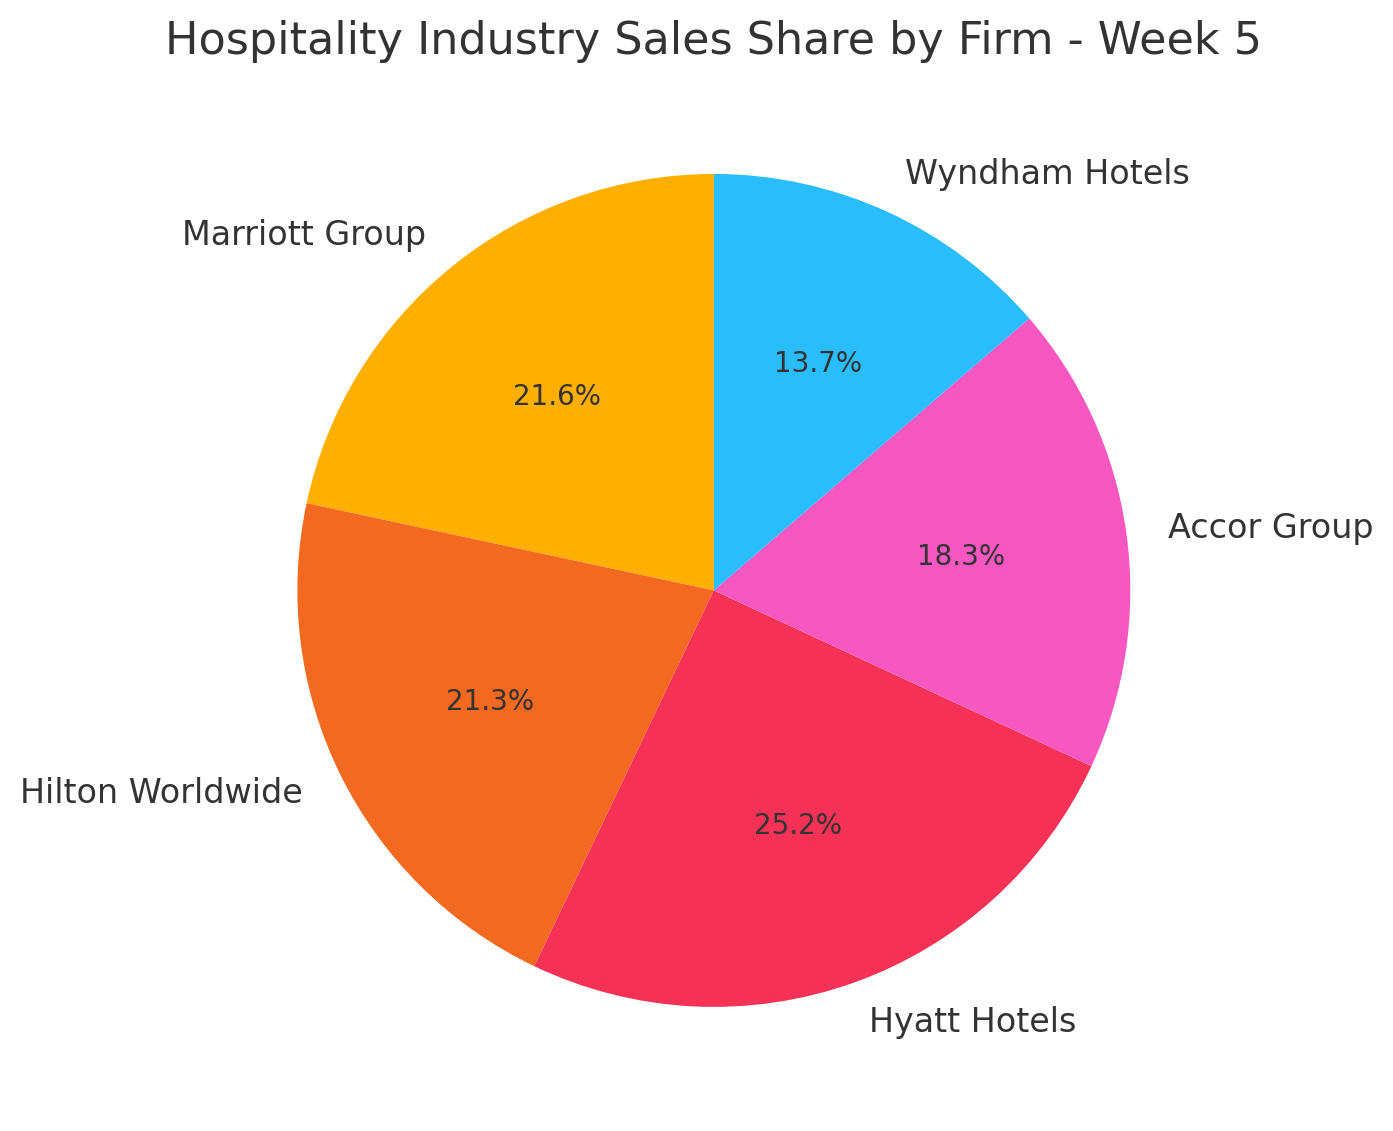
Charts — Weekly / Monthly / Quarterly Examples
Top Menu Items
Channel Mix
Export
Export charts as PNG or download CSV.
Filters
Toggle metrics for overlays.
All Details — Implementation Notes
- Data sources: POS, Booking, Payroll, Inventory, Reviews API.
- Delivery cadence: weekly (email + PDF), monthly (interactive dashboard + call), quarterly (full review + strategy deck).
- Multi-location: use location-level rollups and a global aggregate for executives.
- Security: OAuth for data connectors; per-location access control.
- Customization: white-labeling, translated reports, region-specific KPIs.
Country Focus — Main Markets & Locations
Choose a primary country focus and manage location-level reports. This dashboard includes sample main countries and flexible location groups for enterprise rollups.
Active Locations
Industry: Hotels
RevPAR, ADR, occupancy, booking lead times, channel revenue split.
Industry: Quick Service
Speed of service, throughput, basket size, peak-hour staffing.
Industry: Events / Catering
Contract vs. spot revenue, margins per event, logistics KPIs.
Custom Section Templates
Create, duplicate, and rename sections for bespoke reporting per client.
Integrations & Connectors
Supported connectors for fast onboarding.
POS
Toast, Square, Lightspeed, Revel
Reservations
OpenTable, Resy, SevenRooms
Payroll
ADP, Gusto, Local payroll providers
Reviews & Sentiment
Google, Yelp, TripAdvisor
Templates & Distribution
Pre-built templates for weekly, monthly and quarterly reports. Configure recipients and schedule automated delivery.
Weekly Executive Snapshot
One-page PDF + key charts, emailed every Monday.
Monthly Deep Dive
Interactive dashboard link + annotated deck.
Quarterly Board Pack
Financial model, site benchmarking and recommendations.
Accessibility & Localization
- WCAG contrast checks and keyboard navigation.
- Locale-aware number and date formatting (USD, GBP, INR, AED).
- Right-to-left (RTL) support and language translations.
- Data residency & GDPR/PDPA considerations for each country.